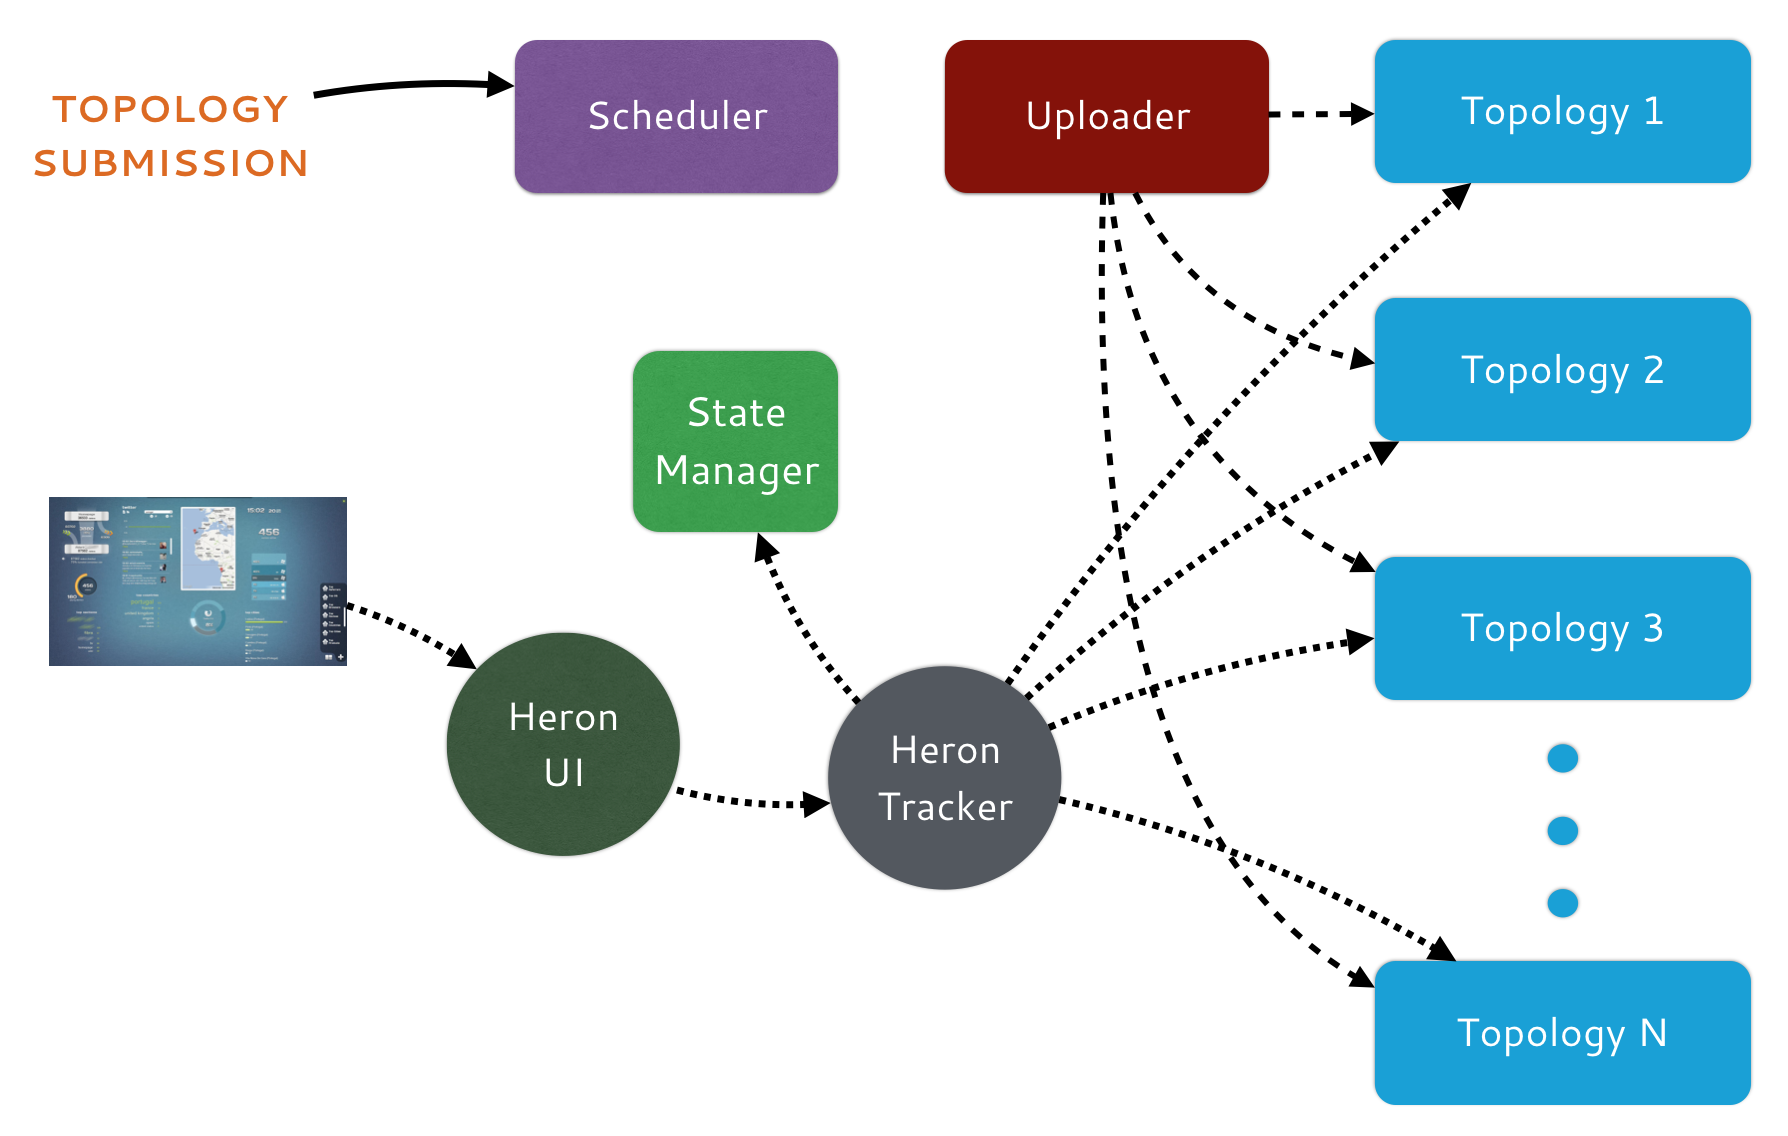
Heron is designed to be run in clustered, scheduler-driven environments. It can
be run in a multi-tenant or dedicated clusters. Furthermore, Heron supports
multiple clusters and a user can submit topologies to any of these clusters. Each
of the cluster can use different scheduler. A typical Heron deployment is shown
in the following figure.

A Heron deployment requires several components working together. The following must be deployed to run Heron topologies in a cluster:
Scheduler — Heron requires a scheduler to run its topologies. It can be deployed on an existing cluster running alongside other big data frameworks. Alternatively, it can be deployed on a cluster of its own. Heron currently supports several scheduler options:
State Manager — Heron state manager tracks the state of all deployed topologies. The topology state includes its logical plan, physical plan, and execution state. Heron supports the following state managers:
Uploader — The Heron uploader distributes the topology jars to the servers that run them. Heron supports several uploaders
Metrics Sinks — Heron collects several metrics during topology execution. These metrics can be routed to a sink for storage and offline analysis. Currently, Heron supports the following sinks
File SinkGraphite SinkScribe Sink
Heron Tracker — Tracker serves as the gateway to explore the topologies. It exposes a REST API for exploring logical plan, physical plan of the topologies and also for fetching metrics from them.
Heron UI — The UI provides the ability to find and explore topologies visually. UI displays the DAG of the topology and how the DAG is mapped to physical containers running in clusters. Furthermore, it allows the ability to view logs, take heap dump, memory histograms, show metrics, etc.